
Hi, Office Insiders! My name is Camille Birch, and I’m a Product Manager on the PowerPoint team. I’m incredibly excited to share that PowerPoint now supports embedding live, interactive Power BI reports right into your slides!
Interactive data storytelling with Power BI
By embedding live Power BI reports in your slides, you can tell interactive, data-focused stories. No more copying and pasting inevitably out-of-date screenshots or switching between your PowerPoint slides and your Power BI report during a presentation. You can now build narratives around your data and drive meaningful conversations through interactive reports right in PowerPoint.
This feature is a long-standing customer request. We are happy to bring it to you and support your growing needs for data storytelling in increasingly data-driven workplaces and cultures.
How it works
- Open a new or existing presentation in PowerPoint.
- To insert a Power BI report in the current slide, select Insert > Power BI.
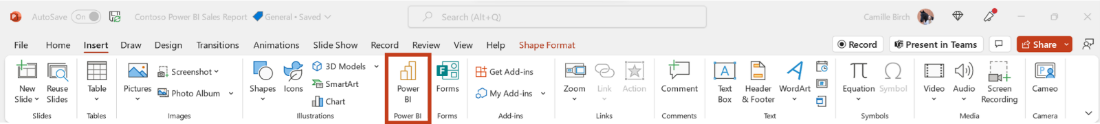
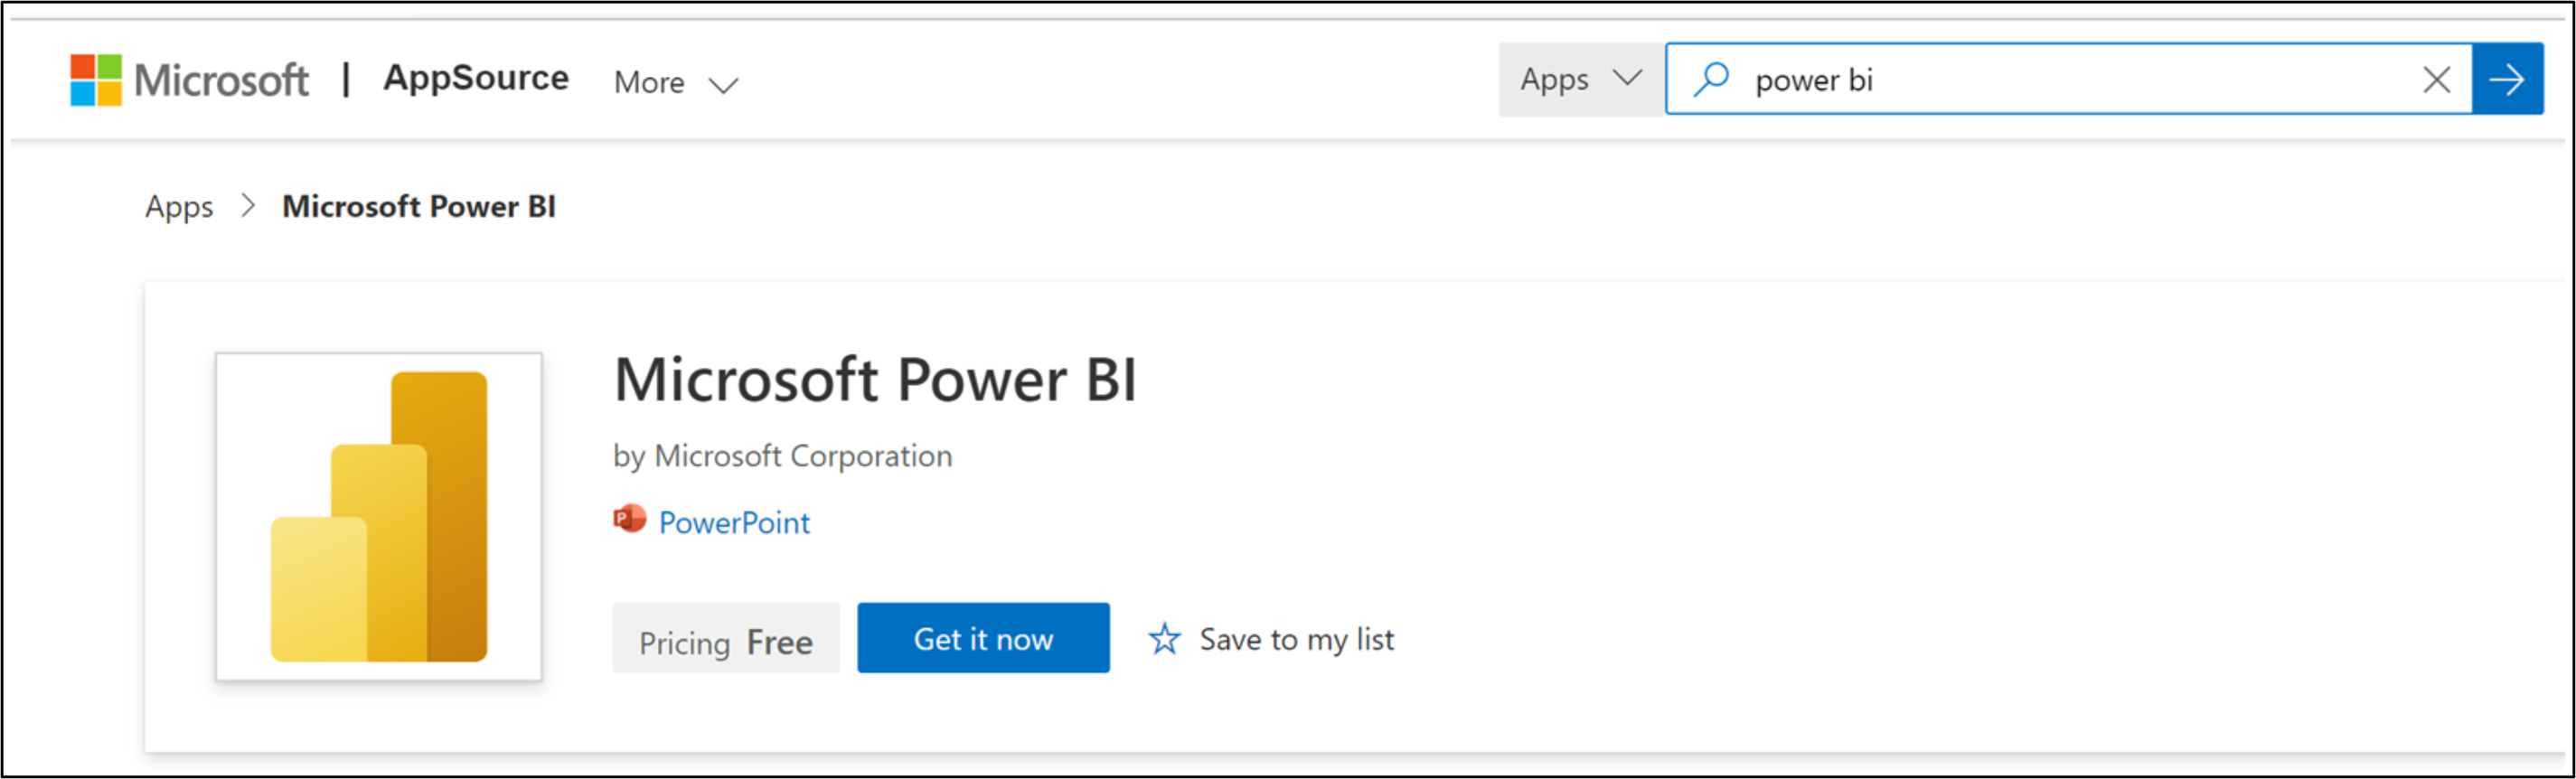
NOTE: If you don’t see the Power BI button in the ribbon, you can get the add-in from the Microsoft App Store.
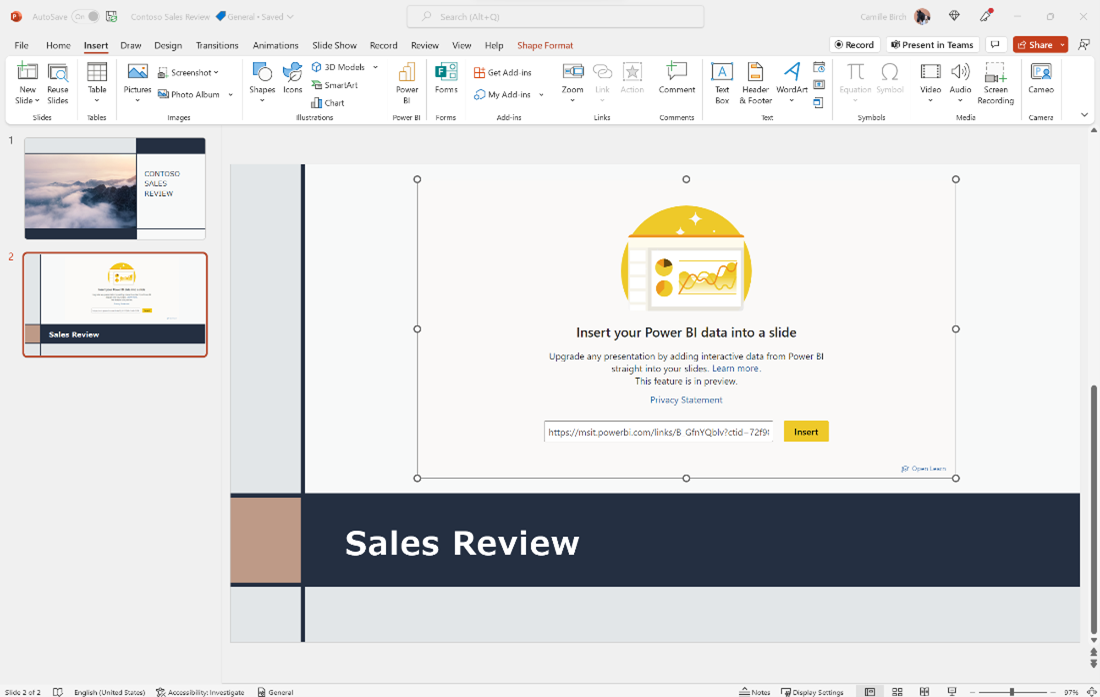
- Copy the link to the Power BI report you want to insert, paste it into the Paste report page URL here box, and then select Insert.
When the report has been loaded into the slide, it is live and interactive both in Edit and Slide Show view. Any change that you make in Edit view–such as updating a slicer or changing a filter–is automatically saved. So feel free to customize the view of the data you want to present in advance.
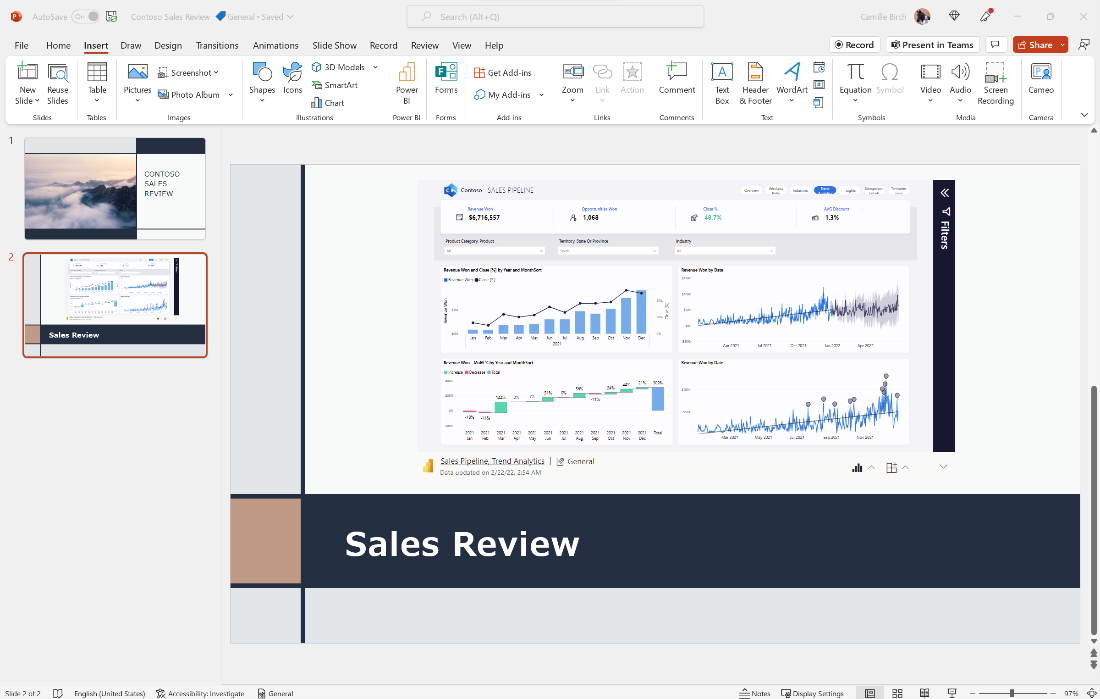
You can also filter and pivot to different views of the data to showcase key points and insights.
Tip and tricks
- If you want your data view to remain static (to prevent data refresh or changes to filters/slicers), you can freeze the current live view to turn it into an image. In the top-right corner of the report, open the menu and select Show as Saved Image. This will convert the report view into an image until you select this option again to unfreeze it.
- To view the interactive data during your presentation, attendees will need to have a Power BI subscription and be logged in with an active account, and have access to the report (unless you’ve frozen the view as an image, as discussed above). To ensure that anyone you share the presentation with will have access to the report, share a link from Power BI by clicking Share > PowerPoint.
Known issues
- Reports are not interactive in PowerPoint Live.
- When viewing the Power BI report in Slide Show view in PowerPoint for web, you may be prompted to authenticate.
- The presentation will not inherit the sensitivity label assigned to the Power BI report when inserted. For example, if a Power BI report labeled as Confidential is inserted into a presentation labeled as Public, the presentation’s label will not change and will remain as Public.
Requirements
You must have an active Power BI subscription to use this feature.
Availability
The Power BI ribbon button in PowerPoint is rolling out to Insiders who are running Beta Version 2201 (Build 14825.10000) or later.
All users can install the Power BI add-in from the Microsoft App store.
Don’t have it yet? It’s probably us, not you.
Features are released over some time to ensure things are working smoothly. We highlight features that you may not have because they’re slowly releasing to larger numbers of Insiders. Sometimes we remove elements to further improve them based on your feedback. Though this is rare, we also reserve the option to pull a feature entirely out of the product, even if you, as an Insider, have had the opportunity to try it.
Feedback
We want to hear from you! Please click Help > Feedback to give us input about this feature.
Learn what other information you should include in your feedback to ensure it’s actionable and reaches the right people.
Sign up for the Office Insider newsletter and get the latest information about Insider features in your inbox once a month!